Cost per Gigabase
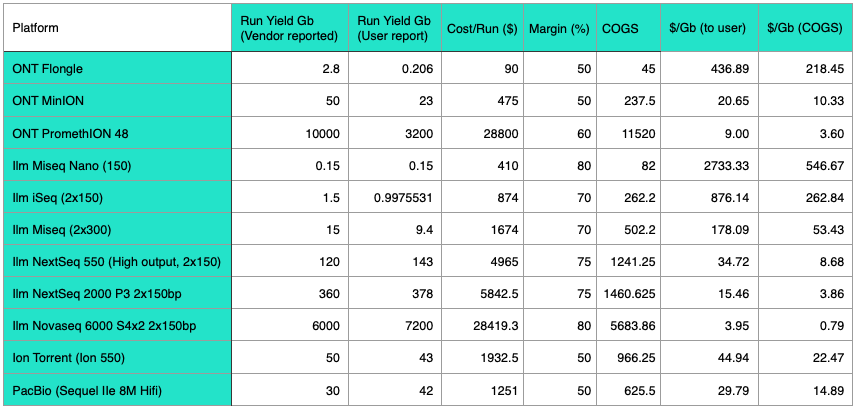
In the table above I’ve attempted to calculate the Cost per Gigabase, and Cost of goods sold per Gigabase ($/Gb COGS) for various sequencing platforms. I suspect these numbers are inaccurate, but hopefully are in the right ballpark. I’d welcome any suggestion/better numbers and corrections.
You can download the spreadsheet below and play with the numbers, and read my commentary on the substack.
Illumina
In general user reports for Illumina platforms were relatively easy to find and are mostly in line with what the vendor suggests. I couldn’t find a “Miseq Nano” run in the wild, though I did at least see some users reporting the same yield as Illumina, which suggests it may not be far off. But user reports would be useful.
Illumina don’t make pricing public, but a few sources show the prices they pay (where they have to report single source pricing). These are generally in line with the prices you see service providers or academic labs pricing.
Overall Illumina margins are in the region of 70%. This includes all instruments and consumables, my feeling is that margins are higher on the higher throughput instruments. On their highest throughput run I’ve guesstimated an 80% margin, to be honest this feels low to me… In any case, an upper bound on the Novaseq COGS/Gigabase is $1.18 or if we go with the vendor throughput ($1.42/Gigabase COGS).
Oxford Nanopore
I looked for various reports on Promethion flow cell throughput. This article stated “A single PromethION R10.4 flowcell generated 52.3 Gbp of data with a modal read accuracy of 99%” (published July 2022). This poster stated. “We observed high variability in yield with a mean of 68.5 Gb per cell.” (AGBT 2022). ONT have reported a 10Tb run, this would make the $/Gb 1.15 (or $1.42 if you use 6Tb). User reported yields on a large number of current generation cells (i.e. >48) would be useful here.
I didn’t search as hard to find Minion and Flongle output numbers, the Flongle page states the theoretical maximum, but user reports seem lower than this. Some solid reports showing averages across multiple current generation flow cells would be useful.
Pricing is as listed on the ONT site to the best of my understanding. A PromethION flow cell price of $600 is used which requires buying 2880 flow cells.
2021 accounts listed ONTs margins at 54.8% (combining instruments and consumables). I imagine that margins are lower on the Flongle/MinION than on the PromethION.
From the accounts, revenue seems to be heavily skewed toward the PromethION, it seems like nearly half there revenue comes from 56 customers with “S3” (PromethION) class instruments. So I would imagine margins are also better here..
Pacific Biosciences
The run I found for the Sequel II was actually performed by PacBio, so I wouldn’t be surprised if this was significantly above average. Pricing comes from a random pricing spreadsheet posted on cancer.gov in 2021.. so I wouldn’t be surprised if it was inaccurate.
Pacific Biosciences list overall margins as 47%. Again, this is likely skewed toward consumables, so I’ve guesstimated “50%”.
Ion Torrent
Thermo give public pricing for Ion Torrent chip, so I went with the public price for this. Margins are not listed… but I’ve guesstimated roughly 50%. This is kind of based on my assumption that it’s likely to be similar to Pacific Biosciences but this might well be entirely inaccurate.