Single Dye Experiments on a Genome Analyzer
I’ve been playing with an old Genome Analyzer 2. This post documents my first attempts to see single dyes, and results which I suspect maybe single dye photobleaching. Hopefully I’ll get round to documenting the rest of the system in another post.
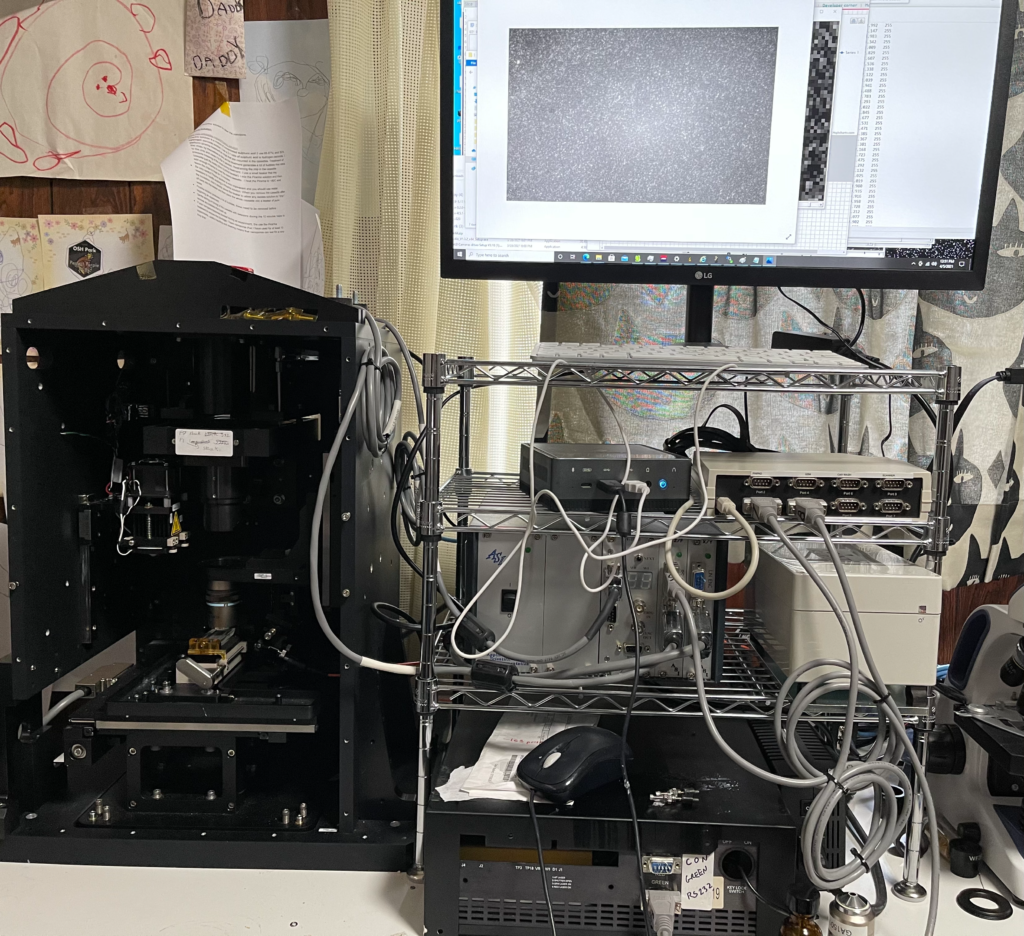
This setup uses the 532nm Quantum GEM laser with a Nikon ELWD 40x DIC (not used for DIC) objective. A 60x ELWD is likely preferable, but this used objective was only ~400USD, cheaper than any 60x I’ve found. The stock camera has been replaced with a cheap monochrome IMX174 (ZWO ASI174MM). This commodity industrial sensor has been used in other single molecule studies. The genome analyzer uses an ASI stage for XY and Z axes, which works with micro manager.. The Quantum GEM laser was controlled using their software. The ZWO camera has a plug which works with micro manager 1.4. Images were taken using the stock Illumina filter (at position 1), this appears to be a long pass filter from ~540nm.
I’m using Atto 542 NHS-ester (AD 542-31). I serially diluted Atto 542 in Ethanol ~16 times diluting by a factor of >40 each time, i.e. less than 1^10-16 of the original concentration. Essentially I pipetted <10uL of solution into 400uL.
I then pipetted ~10uL of the final solution onto 18x24mm cover glass (Matsunami Glass Ind. Ltd.). This took some experimentation. I don’t believe the dye dries evenly on the cover glass. If any kind of residue was visible by eye this indicated that the concentration was too high, and I diluted further.
The prism was cleaned with Ethanol/Kimwipes (likely not ideal). I placed a small drop of Cargille #19569 fused silica matching liquid on the prism. And placed the slide on top of this (after evaporation of the ethanol). The TIRF laser and objective had been previously aligned (which I will describe in another post).
I tried a variety of exposure times, camera settings, and laser powers. I could eventually see something reasonable using the full laser power (550mW), camera binning of 2, and 2000ms exposures, 8bit. Below is an initial capture, where you can see individual “spots” blinking off.
I process this with ImageJ/Fiji. Running a Kalman filter over the image, applying background subtraction, normalization, removing small particles etc. until I could pick out somewhat reasonable spots on the thresholded image. The data is pretty noisy and there are a number of artifacts…
I then ran this though the “Analyze Particles”, to get particle counts…
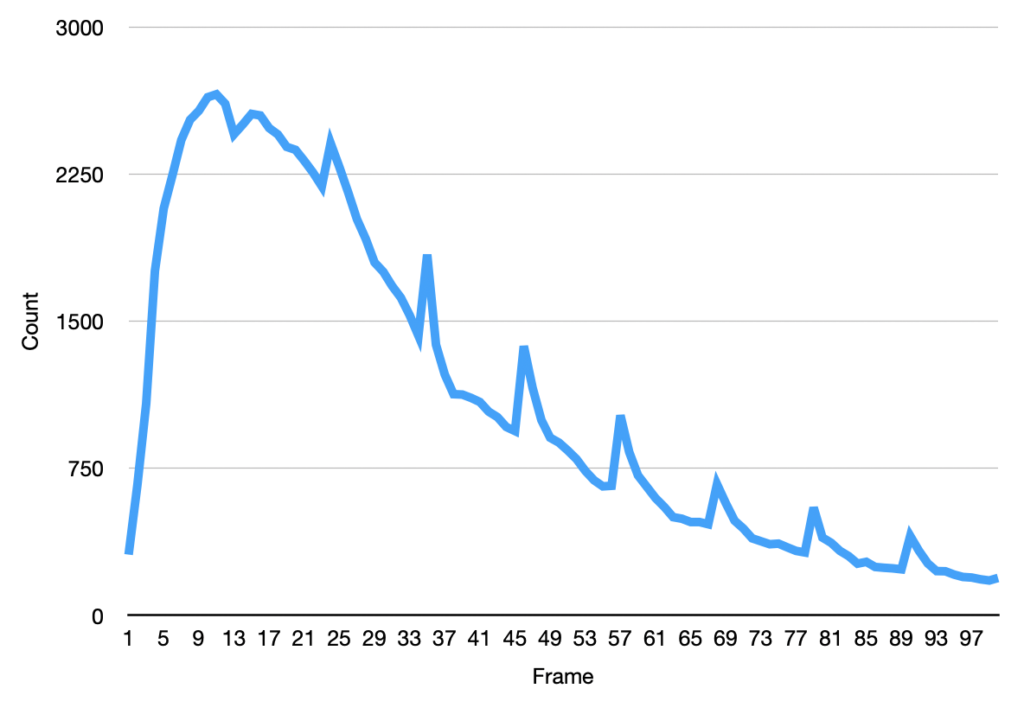
The initial frames don’t process correctly (the image is too saturated with spots, and the particle identification doesn’t work correctly). This causes the initial “slump” but from around frame 13 we see a roughly exponential decay. This seems consistent with single dyes. Why we see periodic peaks is less clear. I suspect this is spike noise (as we clearly still pick of false particles in the thresholded images). At higher framerates you can sometimes see the laser intensity pulsing, and I suspect this is an artifact of that.
Raw image data is available here: ATTO_14.