Apton Biosystems Update
I’ve previously written about Apton Biosystems. When I wrote that post there wasn’t much to go on. However, a patent [2] has recently been published which reveals a bit more information.
The motivation stated in the patent is that “to reach a $10 30× genome”…”the amount of data per unit area needs to increase by 100 fold”. Elsewhere in the patent they mention that the prior art is a pitch of 1 micron. HiSeq wells were ~500nm. So they want decrease well size to ~100nm.
This premise, is slightly shaky as Illumina flowcells and reagents are sold at significant profit. I imagine a large part of Illumina’s costs are related to logistical issues, rather than consumables themselves.
In any case, the patent proposes a massive cost reduction by more densely packing DNA on the flowcell. The patent mostly refers to ordered arrays, and many examples refer to a single molecule approach. The basic chemistry however seems to be pretty standard Illumina style sequencing-by-synthesis.
The figure below shows a simulation of DNA attached to a surface, at varying pitch (spacing). The right-hand images are de-convoluted versions of the left. It’s clear that as the pitch gets smaller, the image gets more crowded, and it’s harder to identify individual spots.
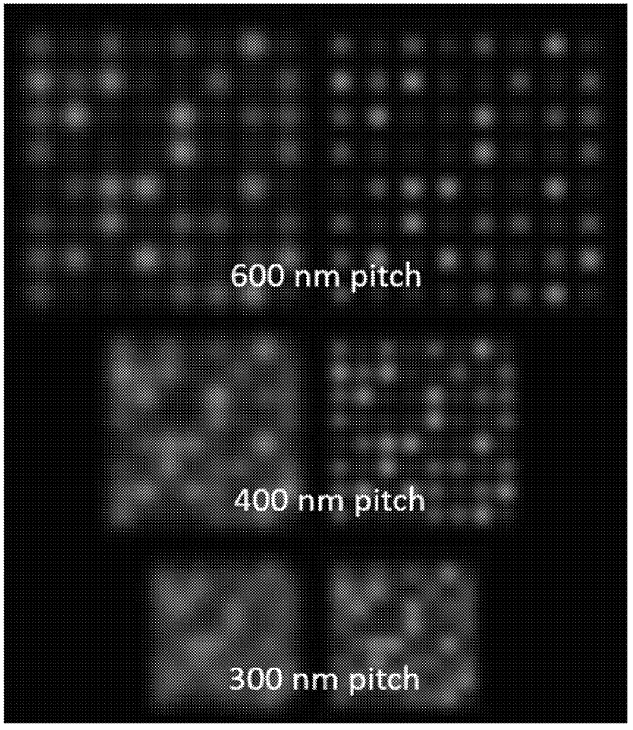
When imaging using a standard optical microscope, you would expect your density to be diffraction limited. Essentially, you can’t clearly identify features smaller than the wavelength of light (~200nm)… normally.
However, a number of recent techniques have broken the diffraction limit. These have allowed optical microscopes to resolve features down to 10s of nanometers. In this patent, Apton apply some “super-resolution”-like approaches… but in a limited scope (we’ll revisit what Illumina might be doing here later).
A basic super-resolution approach is shown below (not from Apton):
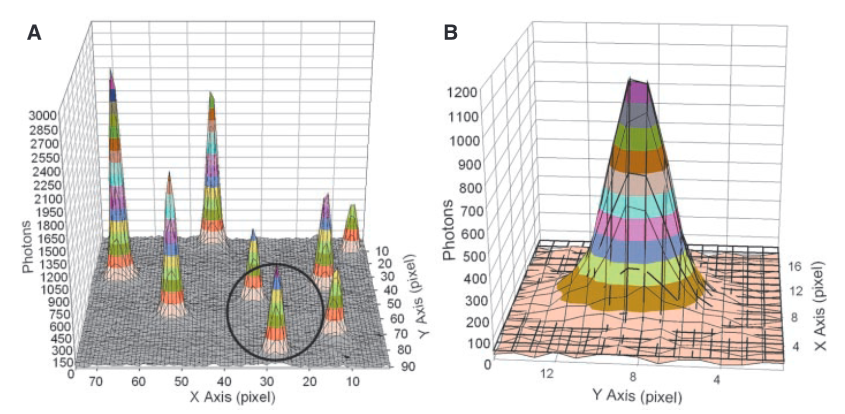
Each “peak” in part A of the figure above is the signal from a single fluorophore. Because the peaks are well separated we can extract each one and look at its distribution. In part B we see a single distribution. This is a 2D Gaussian. If we just took the pixel of highest intensity as the location of the fluorophore our resolution would be diffraction limited to ~200nm. However, by performing a Gaussian fit over the distribution we can determine the location to sub-pixel resolution. In this case, they could identify fluorophore locations at a final resolution of 1.5nm.
The above approach only works because the flurophores are well separated. If the Gaussians overlapped, the fit wouldn’t work. In the image above you can see the FWHM of the Gaussian is about 3 pixels, this represents ~250nm on the surface. I’d imagine if flurophores were any closer than this you’d have issues.
In their patent, Apton use the above approach to identify positions of single DNA strands on the surface to a sub-diffraction limited resolution of “10 nm RMS or less”. Apton appear to use essentially the above approach. However they have a problem, they want to pack the molecules as closely as they can to improve density. This means they are not well separated like those in the figure above.
To get round this Apton seem to use a couple of approaches. The first is that they use signals from multiple cycles to identify molecule positions. If the oligos attached to the surface have a fairly random distribution of bases (like the human genome) this should help a lot. For each molecule, you can select a cycle where it is illuminated, but none of its neighbors are. This means there is no crosstalk at this position and you should be able to get a good estimate of its position.
The figure below shows what appear to be images from a real single molecule experiment:
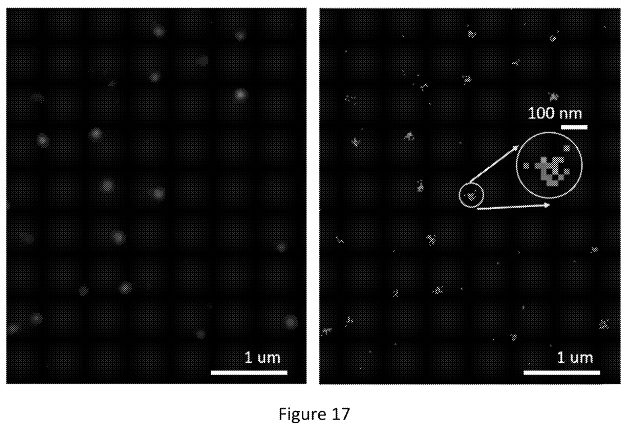
The right image shows positions identified from different cycles piled up (super-resolved positions I assume). In the left image they’ve used these to create another Gaussian. I would guess they then take the peak of this second Gaussian to give the final location of the molecule. This way, they can incorporate information from multiple cycles to give themselves the best estimate of the molecules location.
Using the above process I’d imagine they can get pretty good spot locations. They also mention the use of a crosstalk correction algorithm during the location identification step. But I’d imagine just filtering out bad looking Gaussian would work reasonably well.
While they may now have good spot/molecule locations this doesn’t mean they can pack DNA at ~10nm on the surface. This is because in any given cycle, there will be adjacent molecules which are fluorescing. The resulting Gaussian PSFs as imaged will overlap meaning that spots can’t be resolved. This is essentially crosstalk between adjacent spots.
Apton appear to be trying to use there super-accurate spot locations as the input to their crosstalk correction algorithm. The crosstalk correction process isn’t described in detail. But I can see that with very accurate spot locations, you can parameterize a model to which you can fit your observed signal.
This sounds great, but crosstalk seems to increase exponentially:
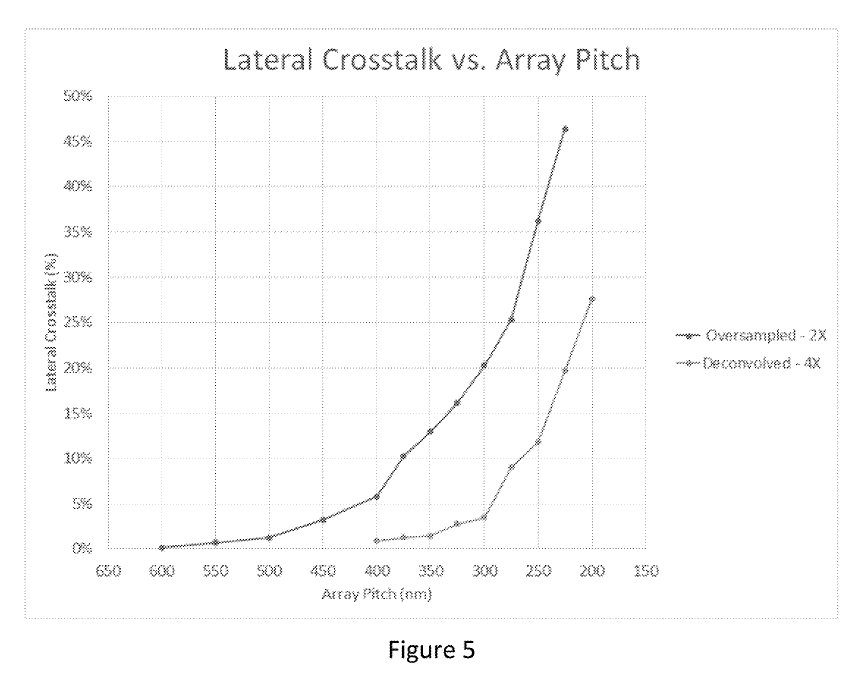
The examples say “molecule locations are resolvable with molecule-to-molecule distances under 200 nm” and elsewhere they say “acceptable crosstalk levels” … “occurs for pitches at or above 210 nm”.
So it seems based on this, a pitch of ~200nm is viable, but it’s not clear that you can go lower than this. This seems unfortunate, as it’s only about a quarter of the size of Illumina’s wells.
What About Illumina?
As mentioned above, super-resolution has been around for a while. In fact, the Genome analyzer 2 used super-resolution-like techniques. Cluster locations could be identified to sub-pixel resolution. Rather than just picking the “brightest” pixel in a cluster, adjacent pixel intensities could be fitted to a PSF to give a more accurate cluster location.
Illumina appear to have now filed a bunch of patents on various approaches to increasing density. One patent uses a DNA-PAINT [3] approach, which they suggest can increase the packing density to “may be less than about 20 nm”. Another describes a STED approach [4] (200nm).
There was however one patent that I found quite fascinating. This approach appears to be for an iSeq-like [6] platform where clusters sit over a CMOS image sensor. The device incorporates additional electrodes which allow an electric field to be created under the cluster.
This field can then be use to electrically deactivate a fluorophore (in one example, by pulling a quencher down on to it):
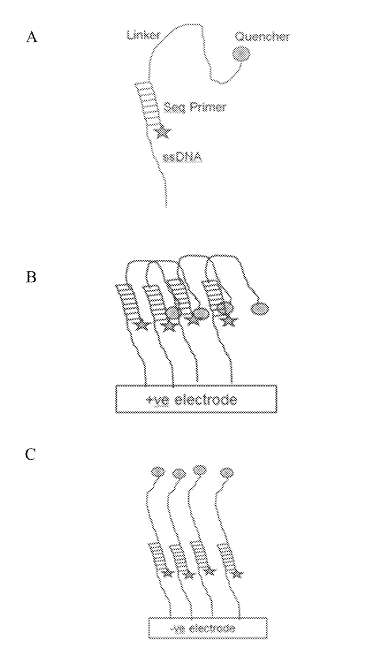
This seems very neat. Essentially it would be that you could image one cluster while quenching all its neighbors. This would remove any crosstalk. Giving you good separation of signals while retaining density. Theoretically you could push clusters very close together.
While the Illumina patents describes some interesting approaches, I didn’t see anything that looked like a real experimental setup or real datasets. So, maybe much of this is theory at the moment. I guess we’ll have to wait an see!
References and Notes
[1] Myosin V Walks Hand-Over-Hand:Single Fluorophore Imaging with1.5-nm Localization.
[2] http://www.freepatentsonline.com/10378053.pdf
[3] http://www.freepatentsonline.com/y2019/0276886.html
[4] http://www.freepatentsonline.com/y2019/0219835.html
[5] http://www.freepatentsonline.com/9193998.html
[6] I don’t see any reason why a similar setup might not be used with a normal (patterned or otherwise) flowcell with embedded electrodes. But the patent seems to focus on a iSeq-like apporach.