Simple Bar and XY line graph in D3.JS
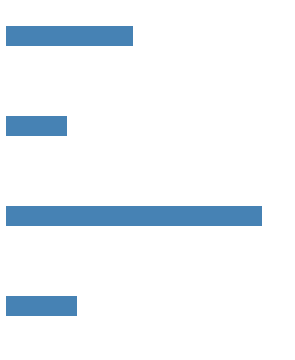
A basic bargraph, as simple as it can be made, largely hacked from various tutorials. It looks like this:
<html>
<body>
<svg class="output" width="500" height="500">
</svg>

<script src="http://d3js.org/d3.v3.min.js"></script>
<script>

var svg = d3.select(".output")

var mydata = [127, 61, 256, 71];

var selection = svg.selectAll("rect")
  .data(mydata)

selection.enter().append("rect")
  .attr("x", 0)
  .attr("y", function(d,i) { return i*90+50 })
  .attr("width", function(d,i) { return d; })
  .attr("height", 20)
  .style("fill", "steelblue")

</script>
</body>
</html>
The linegraph looks like this:
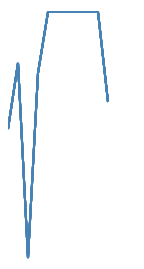
And is again as simple as I could get it. The data contains no X axis coordinate, and is just a flat array. In order to plot this a function provided to D3 infers the X axis from the datapoints index.
<html>

<style>
path {
    stroke: steelblue;
    stroke-width: 2;
    fill: none; //important
}
</style>

<body>


<svg class="output" width="500" height="500">
</svg>

<script src="http://d3js.org/d3.v3.min.js"></script>

<script>
var svg = d3.select(".output")

var mydata = [127, 61, 256, 71, 10,10,10,10,10,10,100];

var selection = svg.selectAll("line")
  .data(mydata)

var valueline = d3.svg.line()
    .x(function(d,i) { return i*10; })
    .y(function(d,i) { return d; });

selection.enter().append("path")
  .attr("class", "line")
  .attr("d", valueline(mydata))
</script>
</body>
</html>