Archive for November 2021

Quanterix

This post previously appeared on the substack.

Quanterix was formed in 2007 with a focus on building a “single molecule” detection platform with a focus on proteomics applications. They raised a total of $533.33M and exited via IPO in 2017.

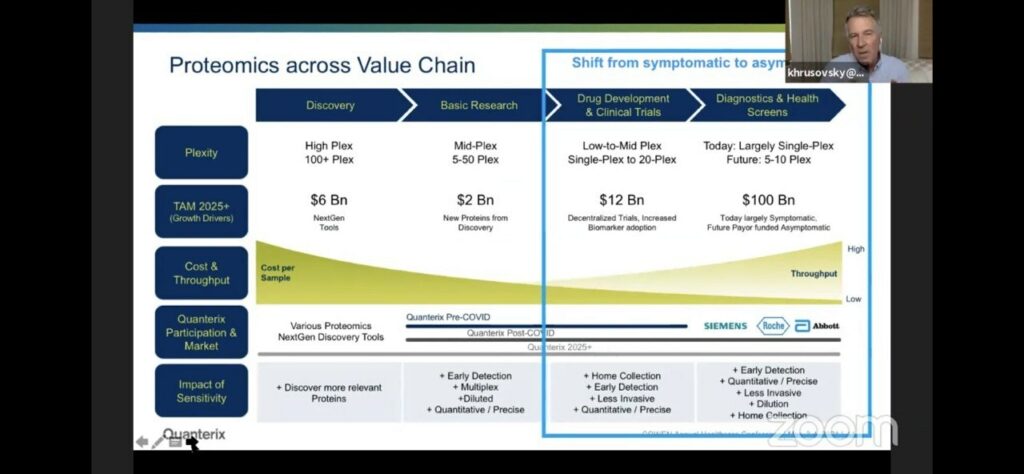
They position themselves as being very high sensitivity, for diagnostics applications. So (as they suggest) you have pretty much every other current and next-gen proteometics player working on “Research Proteomics”, then Quanterix coming in with high sensitivity on the Simoa platform which would be applied to diagnostics:

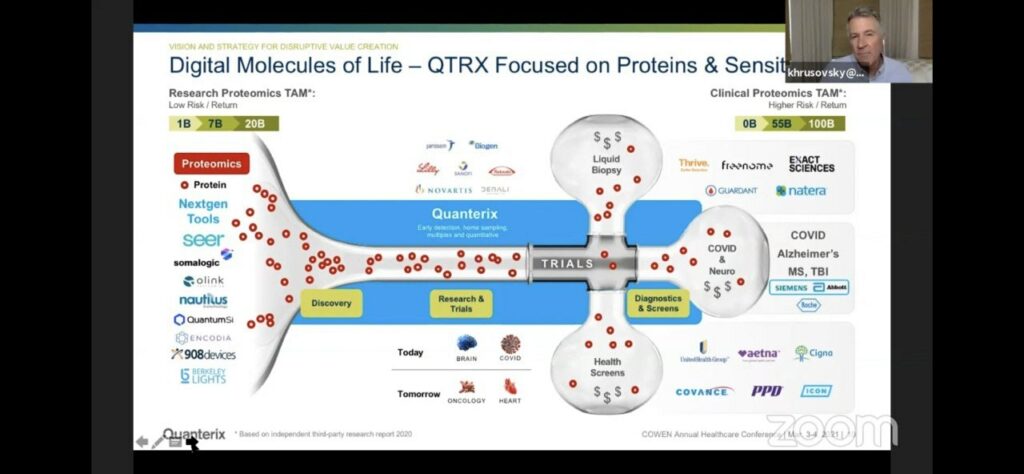
Which of course is where they suggest the big money is:

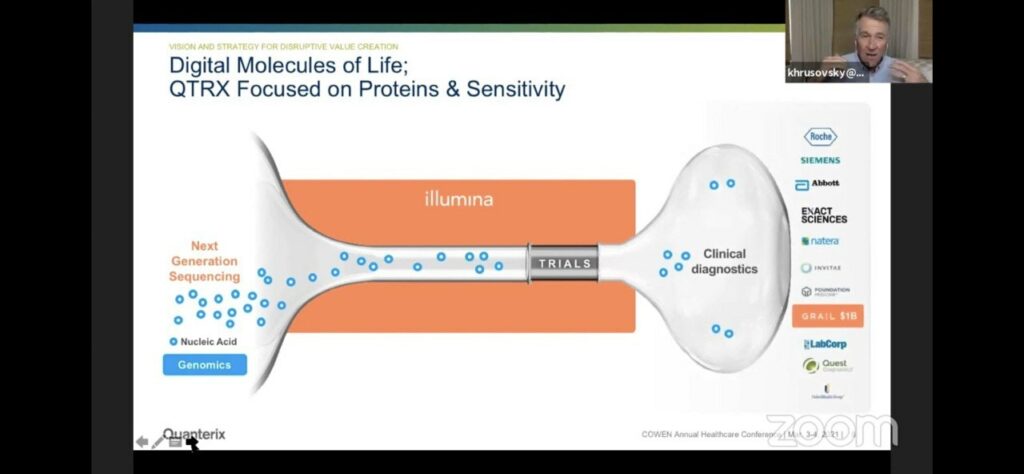
They draw a slightly awkward parallel to Illumina/genomics. Where Illumina make the discovery platform, but the bigger market is likely diagnostics. The analogy is awkward of course, because the Illumina platform often gets used both for discovery and for diagnostic applications [1]. Whereas in Quanterix’s case they’re suggesting that different platforms will be used for discovery and diagnostics.

Of course none of this really tells us much about the nuts and bolts of the Quanterix Simoa approach. But you can find a video here which discusses it in some detail.

Essentially what Quanterix are doing is single molecule ELISA.

In the traditional ELISA approach you have an antibody which binds to an antigen (some protein of interest). Then you have a second antibody, which binds against this first antibody with a linked enzyme. After washing off any unbound antibodies, this enzyme can be used to process a substrate into a product that shows fluorescence. So, you get a kind of amplification reaction, where a single antigen generates thousands of fluorophores.

Quanterix mix this up slightly, by isolating antigens in wells. This means each well shows activity from only a small number (ideally single) antigen (target protein). But through the ELISA process each antigen will generate a large number of fluorophores.

This is therefore not single fluorophore imaging and this should be possible using standard cameras and optics. In DNA sequencing, this likely wouldn’t be termed “single molecule”. As using the same logic you could call Illumina sequencing “single molecule” in that each observation ultimately is sourced from a single molecule [2].

The Quanterix process is described in their 2010 Nature paper:

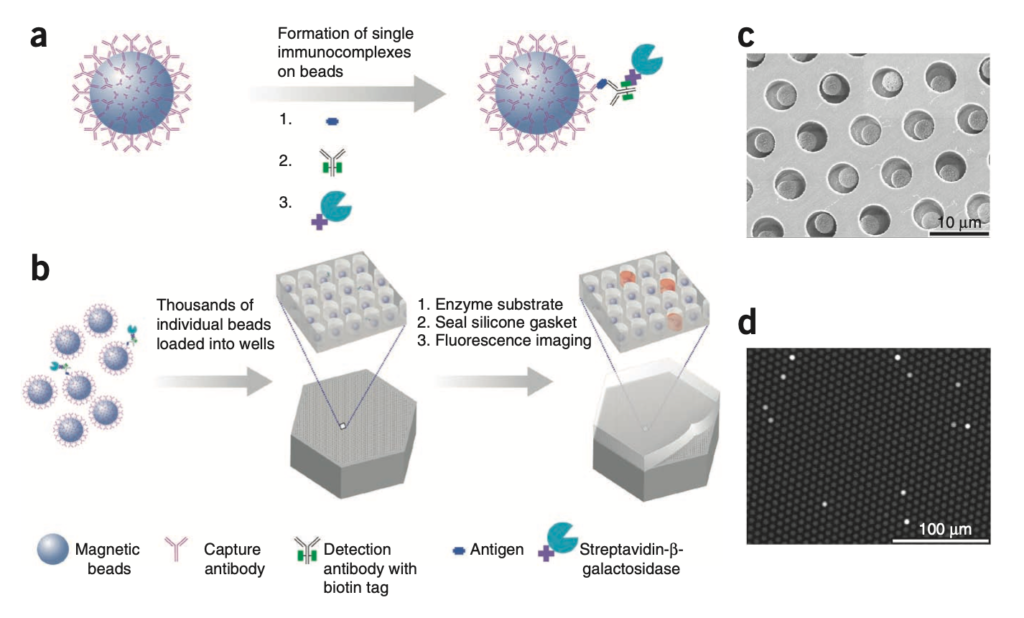
It makes sense that this could give increased sensitivity, as you have more sensing regions to work with, fluorescence is confined to femtoliter wells.

The single well occupancy is Poisson limited. Meaning that you’ll have some percentage of wells with single antigens (at most ~37%) and others with zero or more than one. But of course all wells are telling your something about the overall concentration of the analyte in the solution. What’s also neat, is while at the low end they operate in the digital domain (counting the number of wells with a single active enzyme) at the high end when all wells have one or more enzymes they can switch back to an analogue approach and just average over all intensities. This is part of what gives them higher sensitivity and dynamic range.

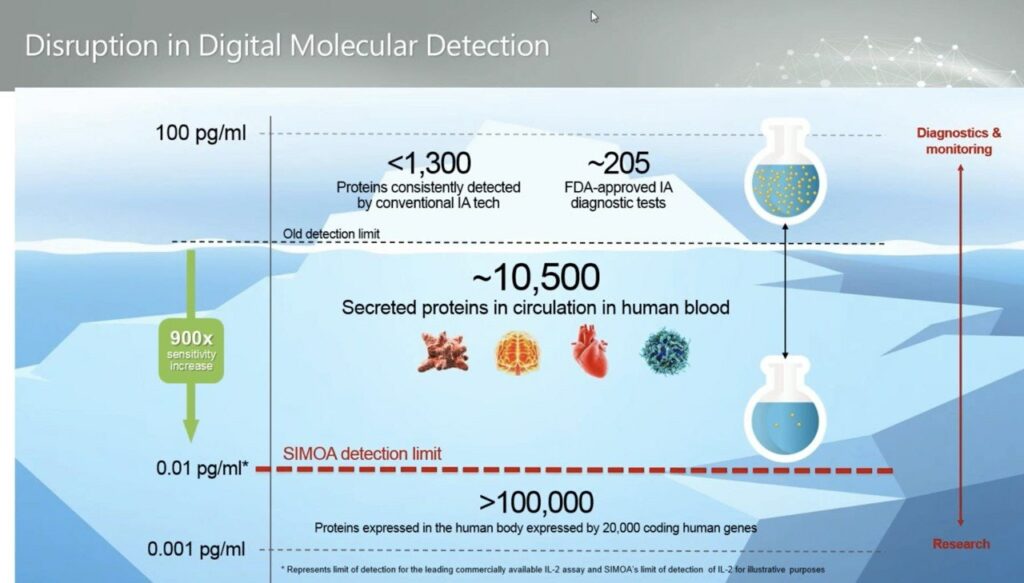
Using this process they claim they can measure down to 0.01 pg/ml, femtomole concentration:

This is great, but some public presentations suggest that in practice noise is somewhat higher in the 1pg/ml range, and that perhaps this is limited by issues relating to the processing of real samples:

This would be more in line with Somalogic and other platforms

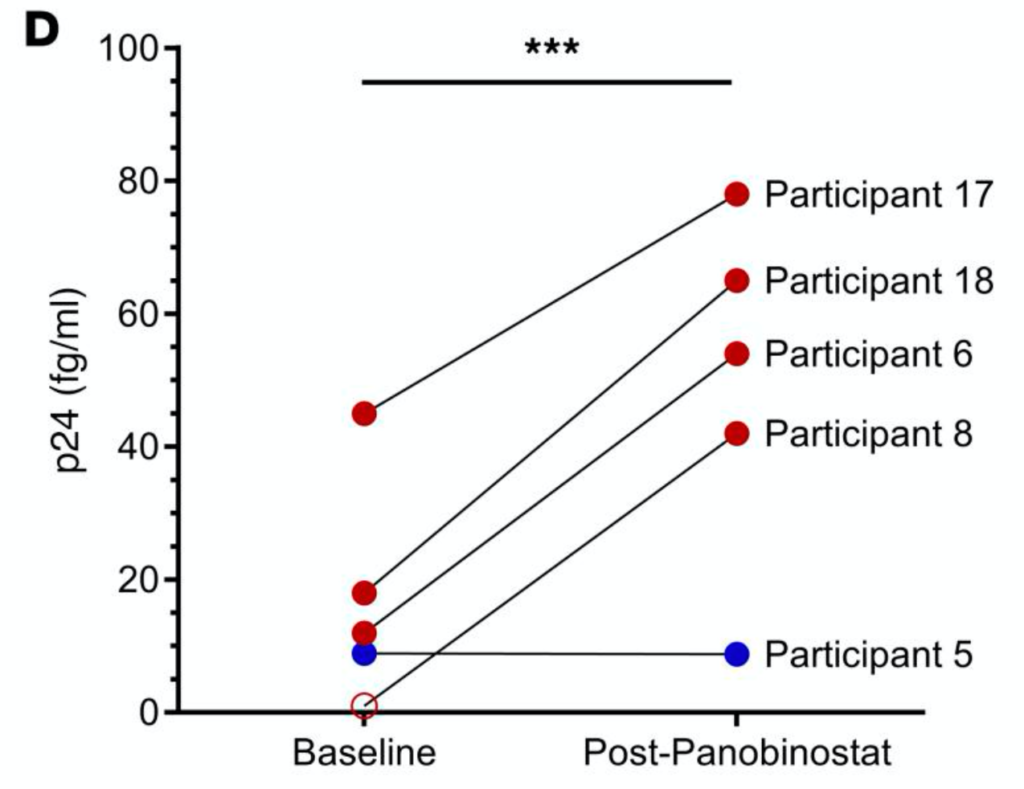
One report where the increased sensitivity does seem to add value is a article where they use the platform to look HIV drugs. In this case using qPCR is problematic (because HIVs mutation rate is so high), so looking at the p24 capsid protein appears to give a better estimate of viral load. Here (at low viral load) the Quanterix platform’s sensitivity appears to add value, showing sensitivity in the 10s of fg/ml range, right at Quanterix’s detection limit:

Increase in p24 (as a proxy for HIV viral load?) after receiving Panobinostat. Here they’re trying to activate HIV that’s dormant to purge these viral reservoirs

The Simoa platform appears to use ~216000 femtolitre wells (seemingly per analyte). In the diagram above these are shown as ~5 micron wells. Much bigger than Illumina’s current feature size, and mostly likely larger than used by Nautilus. So this is likely a modest fabrication problem, and I assume the fabrication costs looks somewhat similar to the Illumina BeadArray platform. I don’t have exact costs for these, but as they appear to be used by 23andme, which look to have ~50% margins, I suspect these chips cost <<$50.

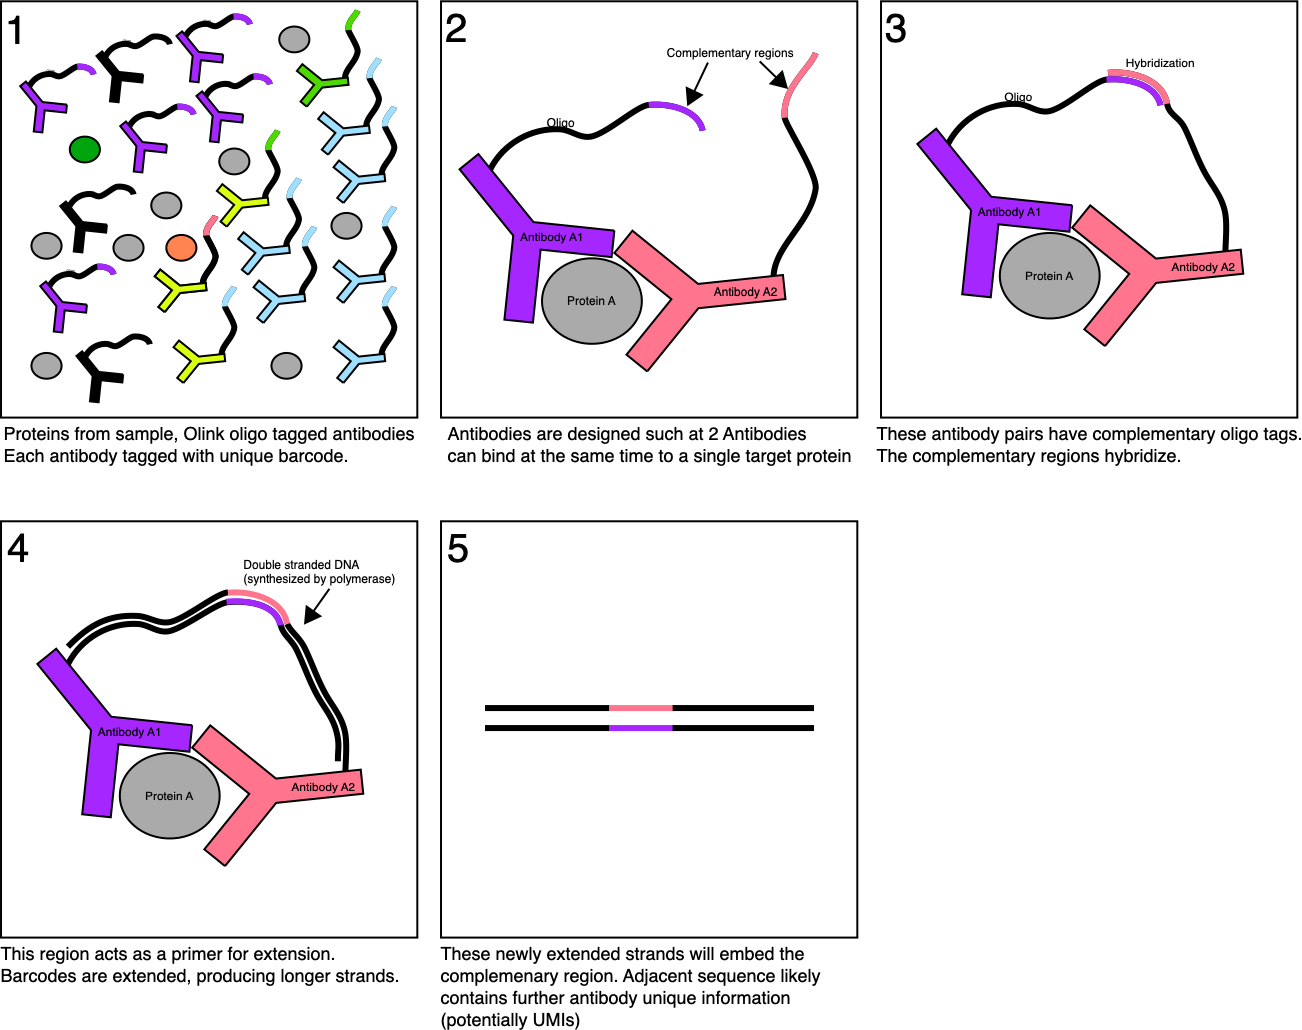
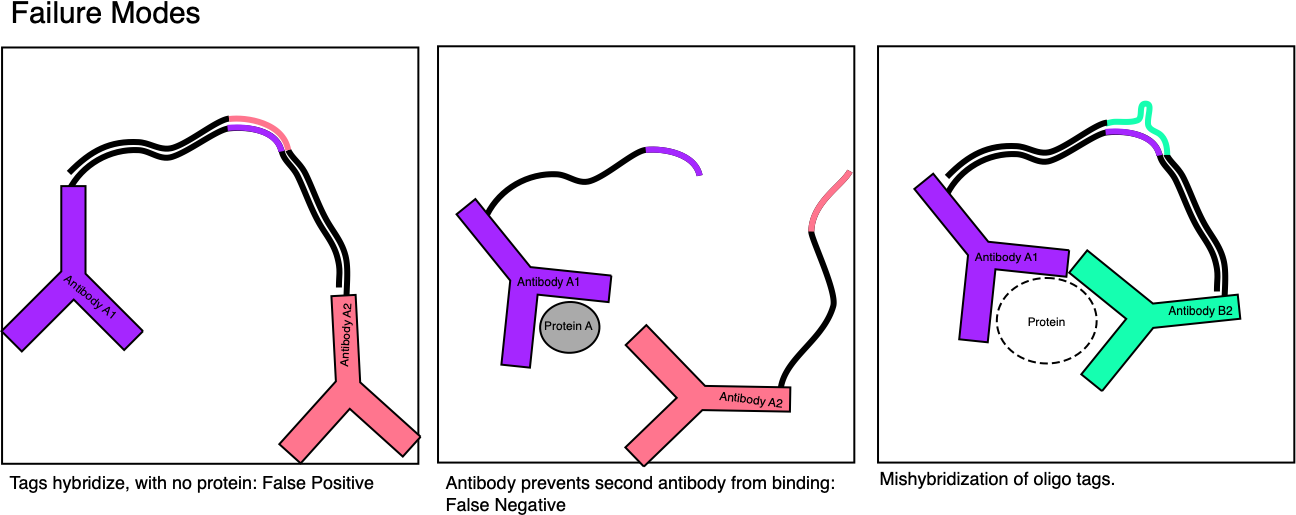
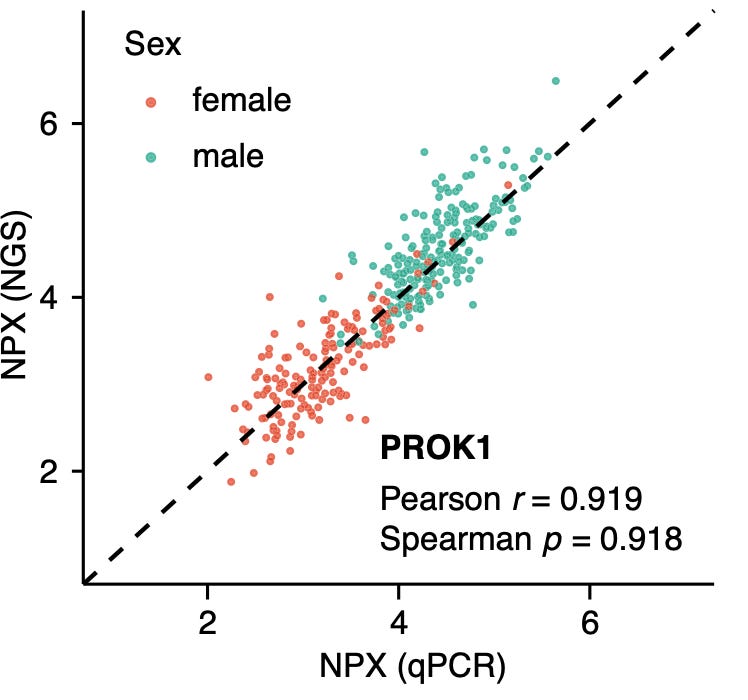
This is relatively cheap, and I suspect cheaper than some other approaches, but may still be too expensive for some diagnostic applications. For example, would this complete with Olink’s qPCR based platform? Which likely costs <$1 per sample.

Final Thoughts

Quanterix may have a platform that can provide higher sensitivity protein detection for some applications. There was one application where this appeared to be useful in practice, and potentially better than other next-gen approaches, but I’d need to dig further to come to any strong conclusion here. It seems likely that their sensitivity is at least “as good as” other cutting edge approaches.

What’s less clear is if their focus on diagnostic applications is realistic. In particular they suggest that approaches will be developed on other platforms (like Olink’s) and then transferred to Quanterix because it’s cheaper and more sensitive. But it’s not clear to me why you wouldn’t for example develop a test on the Olink PEA-NGS platform, and then transfer it to the Olink qPCR platform…

Finally, as I often do, I dug through the Quanterix glassdoor reviews. As always the negative reviews are more interesting than the positive, with numerous comments suggest that the company is “incredibly top heavy” and that “key positions in the company have been taken over by the CEO’s cronies”. “menu content drove everything here. It never mattered whether the assays worked of not. There was never a commitment to product quality”. This and a few of their public statements give me some concern.

But Quanterix are on the market, with 25.4M revenue in Q2. So to some extent, the academic publications and revenue should speak for themselves. I remain slightly more suspicious of their ability to break into major diagnostic applications. But like the idea that you can have a digital readout at the low end and scale to an analogue readout at the high end. This seems like a pretty neat idea.

  1. You could say that this is reasonable viral diagnostics, i.e. COVID19. Where the original sequence (and variants are detected) on the Illumina platform, but you use qPCR for diagnostics based on the reference sequence.
  2. In the case of Illumina sequencing, each cluster is grown from one template, in Quanterix thousands of fluorophores are generated by one antigen.

Olink

This post previously appeared on substack.

Olink is developing a novel sequencing based proteomics platform.

Their 2020 revenue was $54.1 million, 16.7% growth on 2019. This year growth looks set to be higher (in the 50% range). Interestingly the majority of their business seems to be service related (rather than kits). Margins seem to be ~60%.

Olink have a number of offerings, including a new instrument, the Olink Signature Q100. This appears to be an integrated qPCR platform. This doesn’t interest to me so much. I find their NGS based PEA approach more exciting as it lets you assay >1000 (different) proteins. The qPCR approach is limited to ~96 to 314.

In this post, I briefly review the approach and my initial thoughts.

The PEA approach

I’ve summarized the PEA (Proximity Extension Assay) approach in figure below.

Essentially Olink have designed pairs of antibodies with oligo nucleotide tags. Each antibody pair binds to a single protein (type). The antibody pairs are designed with a complementary region. These regions hybridize. The hybridized region is used as the primer for extension by a polymerase resulting in a longer fragment which embeds the complementary region:

So, in the ideal scenario, you only get extension products when both antibodies bind to the target protein. This should help reduce the false positive rate, as you need two concurrent binding events to get a signal.

As it goes that sounds great, but there are a number of potential failure modes:

In particular, we could imagine that there will be some background signal just from antibodies free in solution. They will stochastically encounter each other, the tags will hybridize, and be extended.

The second point is that antibodies are pretty big compared to target proteins. Schematics generally show them as tiny things, but they are likely several times larger than the target protein. This means that antibody pairs probably need to be carefully selected such that both antibodies can bind at the same time.

Finally, hybridization isn’t 100% specific. So lets say we have an unpaired antibody that shows weak binding, the oligo tags while not perfectly complementary, hybridize. Extension occurs and a signal is produced. Many approaches that use hybridization are problematic for this reason. But here it seems like less of an issue. The sequencing readout should provide enough information to filter out these sequences. Non-complementary region may also be providing information about the antibody and can be used to filter non-matching pairs.

However overall it’s clear that antibodies and oligos must be carefully selected to avoid issues. I imagine the development of these antibody libraries must have been a significant effort for Olink. Which makes the development of a library of 1000s of antibodies all the more impressive.

It’s important to note that we’re only identifying protein types, and likely don’t have a route to detecting single amino acid changes. For this reason it doesn’t make sense to directly compare Olink to next-gen protein sequencing approaches.

However Olink’s approach does seem like it would compete against a platform like Nautilus’ at protein fingerprints rather than full sequences.

It also competes against proposed protein sequencing platforms like QuantumSi, if we assume that they never reach their goal of producing full protein sequences, and in reality also only really generate fingerprints. 

PEA-NGS (Olink Explore)

It’s fairly easy to see how the above scheme would work both with qPCR and sequencing. In the qPCR approach I assume the extension products have primer sites for amplification. In the sequencing approach, you just need to sequence through the extension product.

The sequencing approach (Olink Explore) seems to be a little less well developed than the qPCR platform. But there are several interesting recent papers on the approach. In particular, I’ve been looking at a recent Nature Communications article.

Correlation between NGS and qPCR for selected proteins looks pretty good:

It would be interesting to look at raw data across all proteins, particularly low abundance proteins to see where things break. However, raw data isn’t available “due to patient consent and confidentiality agreements”. On their website Olink state that“some proteins have a low correlation. Proteins with lower correlations tended to have limited spread in at least one platform and/or were typically close to the limit of detection”. But I don’t see a raw dataset anywhere.

Olink Explore seems to be available as a kit to use with your own sequencer now. This could mean that raw reads from this platform will start appearing. This would be interesting, as it should be possible to diagnose the various failure modes present in the raw data.

But the fact that qPCR and NGS correlate well is encouraging. 

Other studies, have looked at how well the PEA/Olink approach is correlated with other approaches (below Mass Spec DIA and DDA):

They seem to correlate well in at least some cases, but the data I’ve found it quite limited. One of the issues with these kinds of validation studies is the lack of dynamic range in existing approaches, limits your ability to accurately assess a new platform.

Conclusion

Overall the Olink PEA approach is a neat idea. The data suggests that it works, and the financials suggest that there’s a market for the approach. I suspect that the potential failure modes ultimately limit the platforms accuracy. However, it’s not clear if this is fundamentally better or worse than other approaches.

Ultimately, coming from sequencing, I’d love to see a to see a high throughput single amino acid resolution sequencing platform. Olink certainly isn’t this. But it’s not clear that such a platform will be available in the medium term (say 10 years).

Perhaps Olink-type solutions are the best we can except in the short term.

DU530 CFL Spectra – Again

In my previous post hacking around with the DU530 I showed a spectra from a CFL which matched published spectra. However I was still having a number of issues, particularly with the stepper driver. In particular I was having issues with the stepper skipping steps.

I’ve been using an EasyDriver (clone) and found that if I disabled microstepping everything was working correctly, but when microstepping was enabled steps would be skipped.

I installed a shunt resistor and took a look at the current output on a scope (over the shunt). I used a couple of 0.22Ohm resistors as this is what I had to hand…

The current trace looked like this:

So for some reason it was hitting it’s maximum current output and then just sitting there. I don’t fully understand why, but reducing the current (via the current adjust pot on the board) and increasing the supply voltage (I pushed it to 24, which seems like it’s more than should be required, but still drawing only ~300mA) resolved the issue. I don’t fully understand why the current adjust should have this effect and should probably investigate further. But the traces look fine and I don’t see any missed steps:

With these changes I was again able to resolve the CFL spectra but now I have more freedom with speed/acquisition time…

Acquiring on the scope at a lower speed seems to result in more noise (likely from vibration), but at least a still visible spectra:

This means I can probably move on to acquiring the photodiode output on a microcontroller… a picture of the EasyDriver/shunt is below for reference:

Nanodrop Notes

I recently wrote about various UV-Vis spectrophotometers on the substack. As part of this I discussed the Nanodrop and how its architecture differs from other instruments and the advantages this gives.

The CCD is quite possibly a Sony ILX511 this sensor was a popular CCD in a number of spectrometers, I’ve previously designed a small interface for this sensor.

The layout seems pretty simple, the light from the fiber comes in, hits a mirror then is reflected off a diffraction grating and heads to the CCD:

The auction contains a number of other photos, which includes a fiber cable. I assume this fiber (and all the other components) must be UV compatible which will increase the cost. But overall, its a very simple optical system.

Thermo documentation suggests that older Nanodrops use Xenon Flash lamps. These give a relatively broad output. It doesn’t seem like the Nanodrop has any kind of sensor on the output of the lamp (unlike more traditional UV-Vis instruments) this will make taking a blank measurement all the more important. The blank will be compensating for both emission differences across wavelength in the lamp and the absorbance of the buffer.

Newer Nanodrops appear to use LEDs, I assume this must be a combination of UV and visible LEDs to cover the entire spectrum.

Other references show the Nanodrop setup, and suggest that fused silica (quartz) is used:

The Nanodrop patents are pretty informative, and make it reasonably clear that the fiber optical “pedestals” are just the ends of a couple of SMA connectors “typically the end of an industry standard SMA fiber optic connector 10, FIG. 3(found as connectors on the ends of optical patch cords like p/n P-400-2-UV-VIS from Ocean Optics inc. of Dunedin, Fla.)… For most SMA connectors the approximate 2 mm end diameter can be effectively covered with 2 microliters of water or a water-based solutions.”

A few other pictures from the auction are below, while the auction is listed as Nanodrop monochromator. I suspect this may however be mislabeled, and am continuing to search for Nanodrop teardown images…