Veeco Nanoscope V Multimode AFM First Imaging Tests
Today I decided to get the AFM I have here up and running. I’ve not had any formal training on an AFM (Atomic Force Microscope) so I’m feeling my way as I go. As a first test I wanted to try something with quite large feature sizes, I had no calibration standard so acquired some used wafers (in this case a late 90s FPGA (ProASIC)) with relatively large features as an initial test.
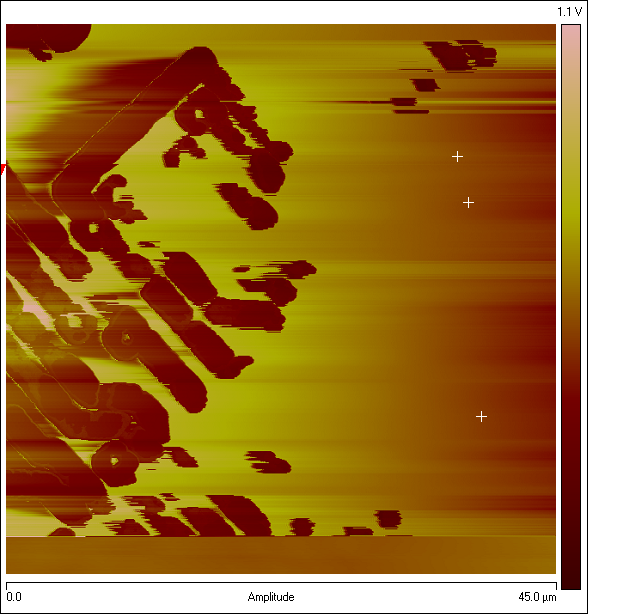
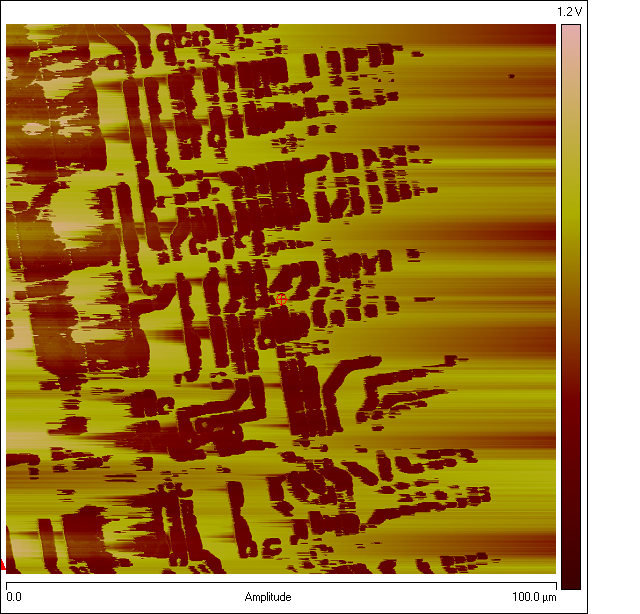
The image above shows some of the features I assume on the upper metal layer of the FPGA. The feature size seems to be around 200 to 700nm which seems about right for 90s tech. Cantilever installation, laser alignment and the imaging process is non-trivial. The videos below document the process I used to get these images:
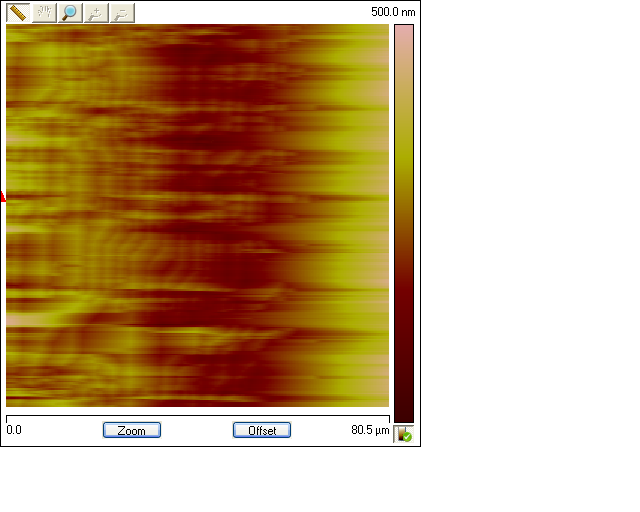
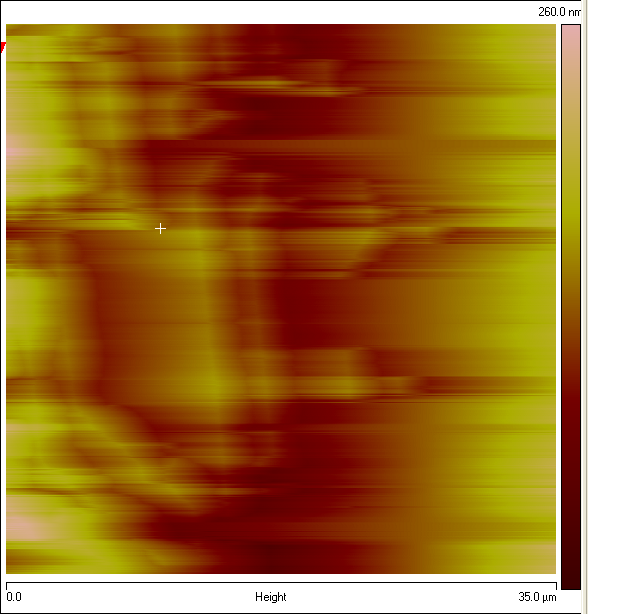
These two images were taken in “height” mode. They didn’t come out very well to my mind. It seems that switching the imaged value to “amplitude” (amplitude of what if not effective height I don’t know) seemed to produce much better images like that shown above.
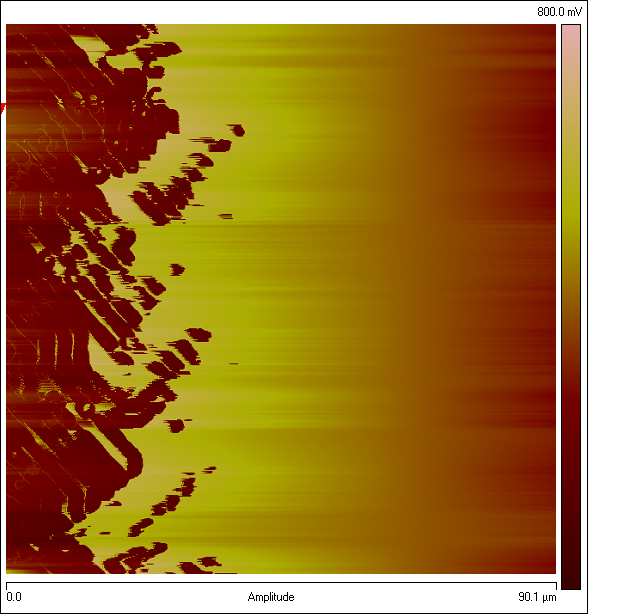
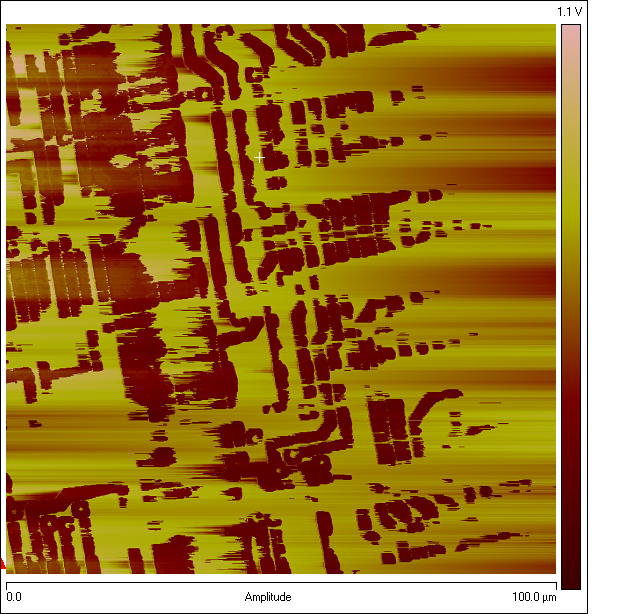
Here are some more amplitude images…
Cool! I use an older version of this AFM at work occasionally. Looks like you’re just scanning way too fast. For a scan that large, try going down to 1Hz or even 0.5Hz. The amplitude signal is the input to the Z feedback loop if you’re operating in AM (amplitude feedback) mode. The height image is the Z piezo voltage i.e. surface topography.
Thanks, I’ll try that. I possibly also need better vibrational/environmental isolation. When I tried lower scan speeds the image was a bit noisy. I’ve heard putting a polystyrene box over the AFM during the scan can help, do you do anything like that?
Nope, it’s just on a small optical table, and there are loud pumps running in the same room. Somewhere in the software you should be able to get a live plot of the height that updates every time a line is scanned. Set the P-gain to zero, the scan speed to 1Hz, and adjust the I-gain until the red and blue curve agree pretty well. If you start to see small oscillations, back off the I-gain.
Ahhhh ok, yes I wasn’t trying any gain adjustments. I’ll try that.