Simple gnuplot histogram example
The gnuplot histogram style wont automagically bin your data. To do this you need to either use an external program, or add some additional code, here a simple example:
set terminal png
set output "hist.png"
set boxwidth 1
set style fill solid
set style histogram
set style data histogram
bw=1
bin(x,width)=width*floor(x/width) + bw/2.0
plot "test.dat" using (bin($1,bw)):(1.0) smooth freq with boxes
Using this data file:
1
2
3
4
5
5
5
5
5
5
5
5
5
5
5
7
8
9
10
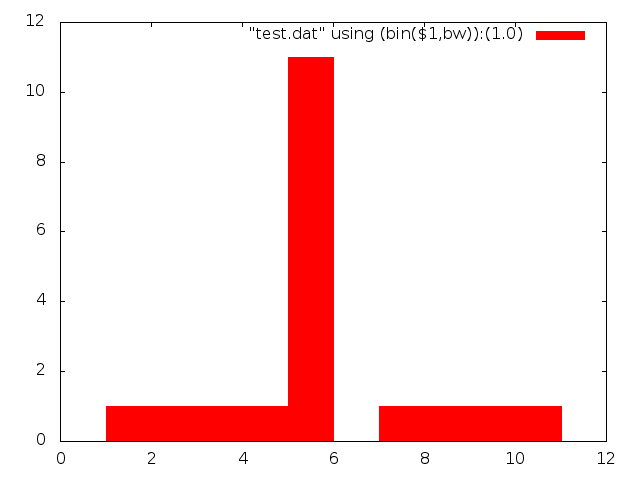
You should see this output: