MSP430 with ST7032i, now working!
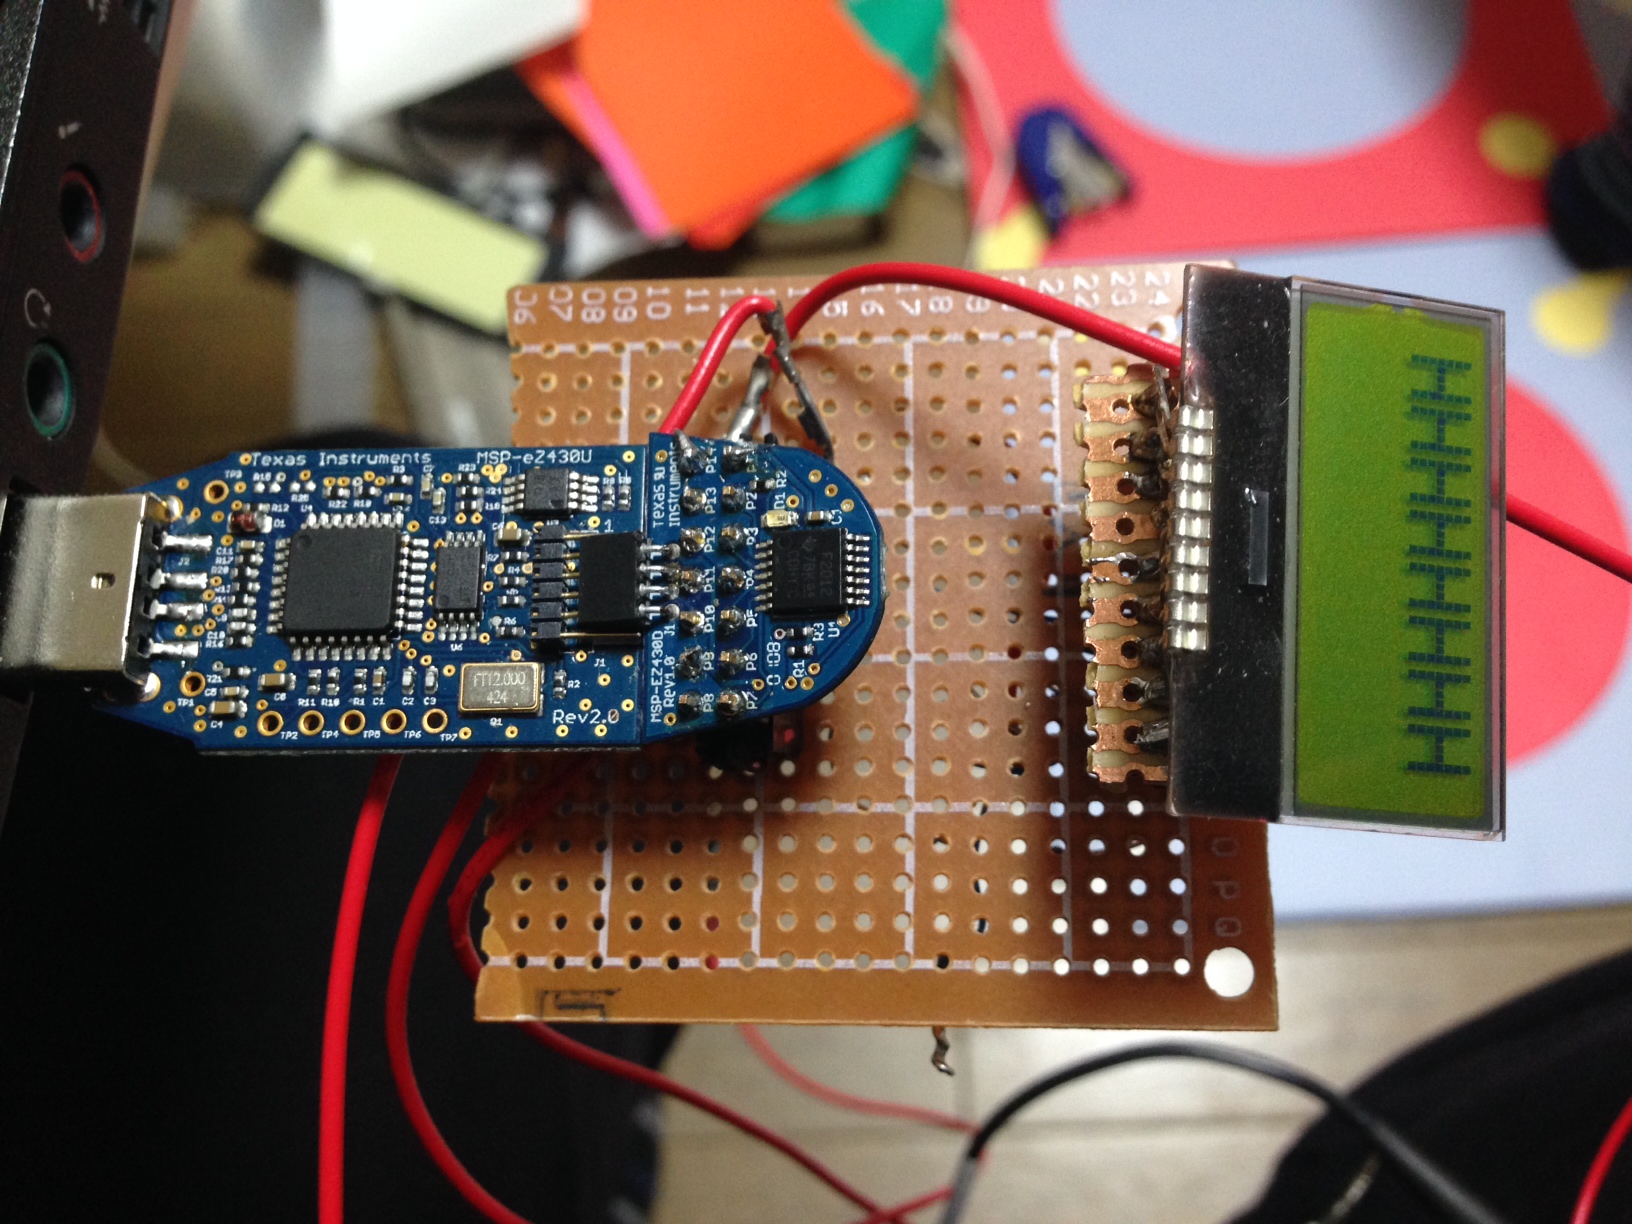
After much fiddling, I got the ST7032i working with an MSP430. The fundamental issue seemed to be getting the I2C data formatting correct. The MSP430 doesn’t have hardware I2C support. What it does have is something called the USI (Universal Serial Interface?). This gives some hardware support for serial transfers, but start/stop/ack bits need to be handled in software. The issue was that the I2C examples provided by TI describe 8bit transfers. With each transfer the address is sent, followed by an ACK, followed by 8bits of data. The USI can also be configured to send 16bits in one go. However the ST7032i doesn’t do either of those things. And it was only after looking at the output of a working Arduino example, and from reading the ST7032i datasheet that I actually understood what was happening.
Basically the ST7032i expects I2C packets that looks like this:
[START][ADDRESS][ACK][DATA1][ACK][DATA2][ACK][STOP]
Such is my understanding a 3am anyway. And this format does appear to work. I’ve no idea if that’s normal for I2C 16bit comms, but certainly on the MSP430 you have to implement those ACKs in the middle of the data in software. For reference the board consumes ~0.5mA at 3.3V.
Current source code is below, complete working example (with header) is available on github. The code below should give some hint of how the process works however:
#include <msp430.h>
#include "ST7032.h"

unsigned short MST_Data1 = 0x40;                     // Variable for transmitted data
unsigned short MST_Data2 = 0x40;                     // Variable for transmitted data
char SLV_Addr = 0x7C;                  // Address is 0x48 << 1 bit + 0 for Write
int I2C_State = 0;                     // State variable

int main(void)
{
  volatile unsigned int i;             // Use volatile to prevent removal

  WDTCTL = WDTPW + WDTHOLD;            // Stop watchdog
                __delay_cycles(250000);
  if (CALBC1_1MHZ==0xFF)			   // If calibration constants erased
  {
    while(1);                          // do not load, trap CPU!!
  }
  DCOCTL = 0;                               // Select lowest DCOx and MODx settings
  BCSCTL1 = CALBC1_1MHZ;               // Set DCO
  DCOCTL = CALDCO_1MHZ;

//  P1OUT = 0x0;
//  P1REN = 0x0;

 /////////////////////// P1SEL |= BIT6 + BIT7;
  // enable all pull up
  //P1OUT = 0xFF;                        // P1.6 & P1.7 Pullups, others to 0
  //P1REN = 0xFF;                       // P1.6 & P1.7 Pullups
  P1OUT = 0xC0;                        // P1.6 & P1.7 Pullups, others to 0
  P1REN |= 0xC0;                       // P1.6 & P1.7 Pullups
  P1DIR = 0xFF;                        // Unused pins as outputs
  P2OUT = 0;
  P2DIR = 0xFF;

  USICTL0 = USIPE6+USIPE7+USIMST+USISWRST; // Port & USI mode setup
  USICTL1 = USII2C+USIIE;              // Enable I2C mode & USI interrupt
  //USICKCTL = USIDIV_3+USISSEL_2+USICKPL; // Setup USI clocks: SCL = SMCLK/8 (~125kHz) // was USIDIV_3
  USICKCTL = USIDIV_3+USISSEL_2+USICKPL; // Setup USI clocks: SCL = SMCLK/8 (~125kHz) // was USIDIV_3
  USICNT |= USIIFGCC;                  // Disable automatic clear control
  USICTL0 &= ~USISWRST;                // Enable USI
  USICTL1 &= ~USIIFG;                  // Clear pending flag
  __enable_interrupt();

  __delay_cycles(4000000);
  int a=0;
    int contrast = 0xff;
  for(int n=1;;n++)
  {
    unsigned char _displayfunction = LCD_8BITMODE | LCD_1LINE | LCD_5x8DOTS;
    _displayfunction |= LCD_2LINE;

    if(n==1) MST_Data1 = 0x00;
    if(n==1) MST_Data2 = LCD_FUNCTIONSET | _displayfunction;
    if(n==2) MST_Data1 = 0x00;
    if(n==2) MST_Data2 = LCD_FUNCTIONSET | _displayfunction | LCD_EX_INSTRUCTION;
    if(n==3) MST_Data1 = 0x00;
    if(n==3) MST_Data2 = LCD_EX_SETBIASOSC | LCD_BIAS_1_5 | LCD_OSC_183HZ;
    if(n==4) MST_Data1 = 0x00;
    if(n==4) MST_Data2 = LCD_EX_FOLLOWERCONTROL | LCD_FOLLOWER_ON | LCD_RAB_2_00;
    if(n==5) MST_Data1 = 0x00;
    if(n==5) MST_Data2 = LCD_FUNCTIONSET | _displayfunction;


    unsigned char _displaycontrol = LCD_DISPLAYON | LCD_CURSOROFF | LCD_BLINKOFF;
    if(n==6) MST_Data1 = 0x00;
    if(n==6) MST_Data2 = LCD_DISPLAYCONTROL | _displaycontrol;

    if(n==7) MST_Data1 = 0x00;
    if(n==7) MST_Data2 = LCD_CLEARDISPLAY;

    if(n==8) MST_Data1 = 0x00;
    if(n==8) MST_Data2 = LCD_ENTRYMODESET |  LCD_ENTRYLEFT | LCD_ENTRYSHIFTDECREMENT;

    if(n==9) MST_Data1 = 0x00;
    if(n==9) MST_Data2 = LCD_FUNCTIONSET | _displayfunction | LCD_EX_INSTRUCTION;

    uint8_t cont = 20;
    if(n==10) MST_Data1 = 0x00;
    if(n==10) MST_Data2 = LCD_EX_CONTRASTSETL | (cont & 0x0f);
    if(n==11) MST_Data1 = 0x00;
    if(n==11) MST_Data2 = LCD_EX_POWICONCONTRASTH | LCD_ICON_ON | LCD_BOOST_ON | ((cont >> 4) & 0x03);
    if(n==12) MST_Data1 = 0x00;
    if(n==12) MST_Data2 = LCD_FUNCTIONSET | _displayfunction;

    if(n==13) MST_Data1 = (uint8_t) 0x40;
    if(n==13) MST_Data2 = 'H';
    if(n==14) MST_Data1 = (uint8_t) 0x40;
    if(n==14) MST_Data2 = 'H';
    if(n==15) MST_Data1 = (uint8_t) 0x40;
    if(n==15) MST_Data2 = (uint8_t) 'H';
    if(n==16) MST_Data1 = (uint8_t) 0x40;
    if(n==16) MST_Data2 = 'H';

    P1OUT |= 0x01;
    __delay_cycles(500);
    P1OUT &= ~0x01;           // LED off
    USICTL1 |= USIIFG;                 // Set flag and start communication
    LPM0;                              // CPU off, await USI interrupt
    // while (!(USICTL1 & USIIFG));// busy wait
    __delay_cycles(1000000);
    if(n==4) {__delay_cycles(4000000); __delay_cycles(4000000);}
    if(n==7) {__delay_cycles(4000000); __delay_cycles(4000000);}
    if(n==32) {n=1;__delay_cycles(4000000); __delay_cycles(4000000); __delay_cycles(4000000);}
  }
}

/******************************************************
// USI interrupt service routine
******************************************************/
#if defined(__TI_COMPILER_VERSION__) || defined(__IAR_SYSTEMS_ICC__)
#pragma vector = USI_VECTOR
__interrupt void USI_TXRX (void)
#elif defined(__GNUC__)
void __attribute__ ((interrupt(USI_VECTOR))) USI_TXRX (void)
#else
#error Compiler not supported!
#endif
{
                //USICNT = USI16B | 16;//(USICNT & 0x0E) + 0x08;       // Bit counter = 8, start TX
  switch(I2C_State)
    {
      case 0: // Generate Start Condition & send address to slave
              P1OUT &= ~0x01;           // LED off
              USISRL = 0x00;           // Generate Start Condition...
              USICTL0 |= USIGE+USIOE;
              USICTL0 &= ~USIGE;
              USISRL = SLV_Addr;       // ... and transmit address, R/W = 0
              USICNT = (USICNT & 0xE0) + 0x08; // Bit counter = 8, TX Address
              //USICNT =  0xE0 + 0x08; // Bit counter = 8, TX Address
              I2C_State = 2;           // Go to next state: receive address (N)Ack
              break;

      case 2: // Receive Address Ack/Nack bit
              USICTL0 &= ~USIOE;       // SDA = input
              USICNT |= 0x01;          // Bit counter = 1, receive (N)Ack bit
              I2C_State = 4;           // Go to next state: check (N)Ack
              break;

      case 4: // Process Address Ack/Nack & handle data TX
              USICTL0 |= USIOE;        // SDA = output
              if (USISRL & 0x01)       // If Nack received...
              { // Send stop...
                USISRL = 0x00;
                USICNT |=  0x01;       // Bit counter = 1, SCL high, SDA low
                I2C_State = 10;        // Go to next state: generate Stop
              //  P1OUT |= 0x01;         // Turn on LED: error
                P1OUT |= 0x01;         // Turn on LED: error
                __delay_cycles(500000);
                P1OUT &= ~0x01;         // Turn on LED: error
                __delay_cycles(500000);
                P1OUT |= 0x01;         // Turn on LED: error
                __delay_cycles(500000);
                P1OUT &= ~0x01;         // Turn on LED: error
                __delay_cycles(500000);
                P1OUT |= 0x01;         // Turn on LED: error
                __delay_cycles(500000);
                P1OUT &= ~0x01;         // Turn on LED: error
                __delay_cycles(500000);
              }
              else
              { // Ack received, TX data to slave...
                USISRL = MST_Data1;     // Load data byte
                USICNT = (USICNT & 0x0E) + 0x08;       // Bit counter = 8, start TX
                I2C_State = 41;         // Go to next state: receive data (N)Ack
              }
              break;

      case 41: // Receive Data Ack/Nack bit
              USICTL0 &= ~USIOE;       // SDA = input
              USICNT |= 0x01;          // Bit counter = 1, receive (N)Ack bit
              I2C_State = 5;           // Go to next state: check (N)Ack
              break;

      case 5: // Process Address Ack/Nack & handle data TX
              USICTL0 |= USIOE;        // SDA = output
              if (USISRL & 0x01)       // If Nack received...
              { // Send stop...
                USISRL = 0x00;
                USICNT |=  0x01;       // Bit counter = 1, SCL high, SDA low
                I2C_State = 10;        // Go to next state: generate Stop
              //  P1OUT |= 0x01;         // Turn on LED: error
                P1OUT |= 0x01;         // Turn on LED: error
                __delay_cycles(500000);
                P1OUT &= ~0x01;         // Turn on LED: error
                __delay_cycles(500000);
                P1OUT |= 0x01;         // Turn on LED: error
                __delay_cycles(500000);
                P1OUT &= ~0x01;         // Turn on LED: error
                __delay_cycles(500000);
                P1OUT |= 0x01;         // Turn on LED: error
                __delay_cycles(500000);
                P1OUT &= ~0x01;         // Turn on LED: error
                __delay_cycles(500000);
                P1OUT |= 0x01;         // Turn on LED: error
                __delay_cycles(500000);
                P1OUT &= ~0x01;         // Turn on LED: error
                __delay_cycles(500000);
              }
              else
              { // Ack received, TX data to slave...
                USISRL = MST_Data2;     // Load data byte
                USICNT = (USICNT & 0x0E) + 0x08;       // Bit counter = 8, start TX
                I2C_State = 6;         // Go to next state: receive data (N)Ack
              }
              break;

      case 6: // Receive Data Ack/Nack bit
              USICTL0 &= ~USIOE;       // SDA = input
              USICNT |= 0x01;          // Bit counter = 1, receive (N)Ack bit
              I2C_State = 8;           // Go to next state: check (N)Ack
              break;

      case 8: // Process Data Ack/Nack & send Stop
              USICTL0 |= USIOE;
              if (USISRL & 0x01)    {   // If Nack received...
                P1OUT |= 0x01;         // Turn on LED: error
                __delay_cycles(500000);
                P1OUT &= ~0x01;         // Turn on LED: error
                __delay_cycles(500000);
                P1OUT |= 0x01;         // Turn on LED: error
                __delay_cycles(500000);
                P1OUT &= ~0x01;         // Turn on LED: error
                __delay_cycles(500000);
                P1OUT |= 0x01;         // Turn on LED: error
                __delay_cycles(500000);
                P1OUT &= ~0x01;         // Turn on LED: error
                __delay_cycles(500000);
                P1OUT |= 0x01;         // Turn on LED: error
                __delay_cycles(500000);
                P1OUT &= ~0x01;         // Turn on LED: error
                __delay_cycles(500000);
                P1OUT |= 0x01;         // Turn on LED: error
                __delay_cycles(500000);
                P1OUT &= ~0x01;         // Turn on LED: error
                __delay_cycles(500000);
                P1OUT |= 0x01;         // Turn on LED: error
                __delay_cycles(500000);
                P1OUT &= ~0x01;         // Turn on LED: error
                __delay_cycles(500000);
              }
              else                     // Ack received
              {
              //  MST_Data++;            // Increment Master data
              //  P1OUT &= ~0x01;        // Turn off LED
              }
              // Send stop...
              USISRL = 0x00;
              USICNT |=  0x01;         // Bit counter = 1, SCL high, SDA low
              I2C_State = 10;          // Go to next state: generate Stop
              break;

      case 10:// Generate Stop Condition
              USISRL = 0x0FF;          // USISRL = 1 to release SDA
              USICTL0 |= USIGE;        // Transparent latch enabled
              USICTL0 &= ~(USIGE+USIOE);// Latch/SDA output disabled
              I2C_State = 0;           // Reset state machine for next transmission
              LPM0_EXIT;               // Exit active for next transfer
              break;
    }

  USICTL1 &= ~USIIFG;                  // Clear pending flag
}

 RSS
RSS